
PadBets Compare: understand odds movement

Last reviewed · Editorial policy
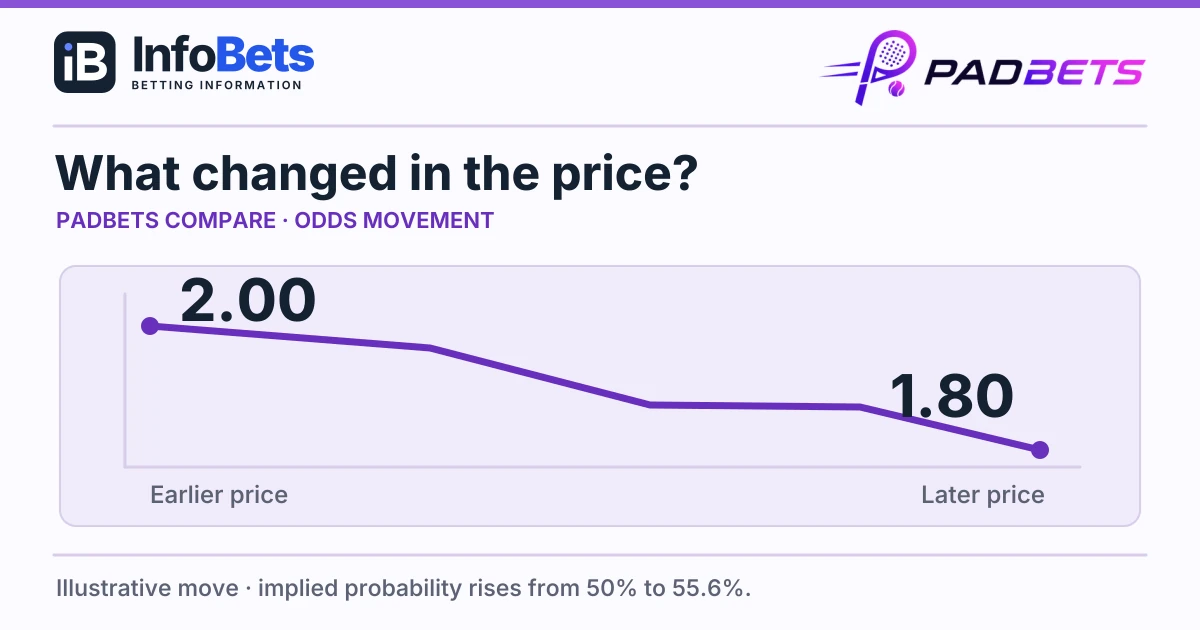
Odds movement is a change in the price quoted for an outcome. In decimal odds, shortening means the number falls; drifting means it rises. PadBets Compare includes movement information to help you follow those changes.
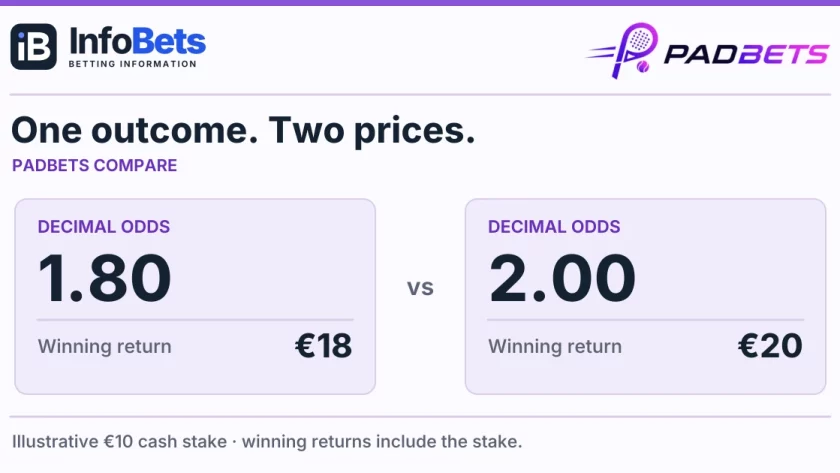
A move from 2.00 to 1.80
In this illustrative example, the decimal price falls by 10%: (1.80 − 2.00) ÷ 2.00 × 100.
Price-implied probability uses a different calculation: 1 ÷ decimal odds. It rises from 50% to approximately 55.6%, an increase of 5.6 percentage points. That is different from the 10% change in the decimal price.
These calculations describe the quote. They are not a measurement of an outcome’s true probability.
Read the move in context
Check the selection, starting price, current price & match status. A pre-match change & a change after a set has been played describe different situations.
PadBets’ Movers view tracks changes in the best available price over the previous 24 hours. The bookmaker supplying that best price can change too, so the combined view may differ from one bookmaker’s own price history.
What the graph can tell you
A price graph shows when a quote changed & by how much. To understand why, look for separate information such as the score, a player update or a change in market availability.
Price history alone does not measure how much money was bet. Reading it alongside the Match Centre is more useful than treating the largest movement as a prediction.
Explore movement in PadBets Compare, then open the match to connect the prices with what was happening on court.
Sources
Sources checked 6 September 2026.

Discussion
Ask a question, add useful context or share a source. Keep it relevant & respectful.
Comments are reviewed before publication.